
When building a application in Rayven, you follow a structured process that ensures scalability, security, and customization for all users:
Step-by-Step Process
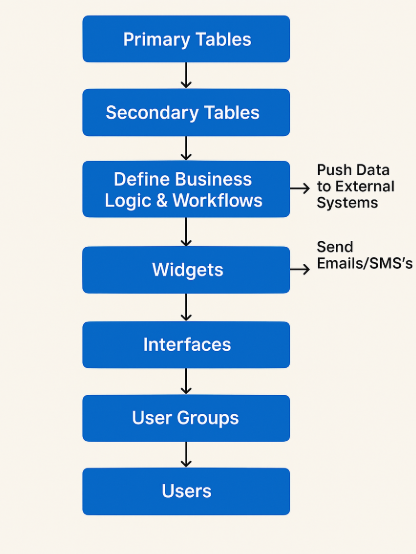
1. Create Your Data Foundation
Primary Tables: These hold your main entities (e.g., assets, customers, devices).
Secondary Tables: Related or supporting data (e.g., logs, history, auxiliary attributes).
Use Data upload to connect external data sources into your Rayven tables.
2. Bring in External Data Via Your Workflow
Use Workflow Connectors to connect external systems, sensors, or APIs and feed their data into your Rayven environment.
3. Configure Business Logic
In the Workflow Builder, set up the logic that transforms, processes, or automates actions based on your data.
This can include calculations, conditions, AI predictions, and more.
4. Connect Logic to Widgets
Still within the Workflow, connect outputs of your logic directly to Widgets (HTML widget, forms widgets, Analytics widgets, and many more...).
Rayven’s Interface Builder enables you to create rich, interactive dashboards and custom user interfaces to monitor, control, and interact with your business applications. A key component of this system is widgets—modular UI elements that display and interact with your data in meaningful ways.
Types of Interface Widgets
Rayven offers a library of built-in widgets for common use cases, including:
-
Charts (line, bar, pie, gauge, etc.)
-
Tables
-
KPIs
-
Controls (buttons, sliders, dropdowns)
-
Maps and location views
-
Forms (for data entry and updates)
These allow users to rapidly build interactive and real-time interfaces without writing any code.
Custom UI with the HTML Widget
The HTML Widget is one of the most powerful tools in Rayven’s interface toolkit. It allows you to go beyond standard widgets by enabling complete customization using HTML, CSS, and JavaScript.
Key Capabilities
-
Build any UI: From styled dashboards to fully interactive elements, you can design exactly what you need.
-
Full Web App Frontends: The widget can be used to create complex single-page application (SPA) style front ends, effectively letting you build a complete web app inside your Rayven dashboard.
-
Use external libraries: Bring in your favorite JavaScript libraries (e.g., Chart.js, D3.js, React if loaded properly).
-
Dynamic data binding: Easily connect HTML widget elements to real-time data from your workflows, MySQL tables, or Cassandra event streams.
-
Trigger workflow actions: Embed buttons, forms, or event handlers that interact directly with Rayven workflows.
Common Use Cases
-
Branded portals with custom layouts
-
Interactive troubleshooting tools
-
Advanced forms and wizards for data entry
-
Custom dashboards with third-party UI libraries
-
Visualization of complex data types (e.g., SVG overlays, custom gauges)
Rayven’s HTML widget bridges the gap between low-code convenience and full-code flexibility, empowering advanced users to build completely tailored user experiences directly within the platform.
5. Define Interfaces
Group widgets into Interfaces (pages/screens).
You decide which widgets appear on which interface depending on the user journey.
6. Set Up Users and User Groups
Create Users and organize them into User Groups based on roles, departments, regions, etc.
7. Control Access with User Groups and Tags
Assign which Interfaces each User Group can access.
Control which data users see by using Tags within tables — filter what data is shown based on the user’s group or attributes.
Navigating and Customizing Your Front-End Interface
Once you’ve finished configuring your application, click on the green link provided in the platform to App interface login. This link will open your front-end web application in a new tab, giving you direct access to the live environment you’ve built.
Interface Overview
-
Left-Side Panel: Displays a list of all available interfaces associated with your project.
-
Quick Navigation: Easily switch between different dashboards or views depending on your access level and user group.
Design & Layout Tools
Rayven.io provides a flexible and user-friendly drag-and-drop builder so you can configure your interfaces exactly the way you need:
-
Drag-and-Drop Widgets: Add, move, and resize visual components like charts, buttons, forms, and data tables with ease.
-
Brand Customization:
-
Upload your company logo.
-
Apply custom color schemes, backgrounds, and font styles to align with your brand identity.
-
-
Modular Layouts: Create layouts that adapt to different screen sizes or user roles.
Collaboration & Sharing
-
Interface Sharing: Securely share specific interfaces with internal or external users.
-
Access Permissions: Control what each user or group can view or interact with at the interface level.
These customization and collaboration features make it easy to deliver tailored, on-brand experiences while maintaining full control over user access and content presentation.

Why This Model Provides Huge Flexibility
-
Custom Experience: Different users see different dashboards, forms, and data without needing multiple apps.
-
Security and Compliance: Sensitive data is isolated and shown only to authorized users.
-
Scalability: As you add new users, groups, or data, you can easily update access rules without rebuilding anything.
-
Faster Deployment: Build once, configure many user experiences.
-
Dynamic Behavior: Widgets and data adapt based on who is logged in, their role, and their permissions.
-
Unified Platform: Whether it's devices, external systems, or manually entered data, it all flows into the same cohesive app structure.
Full In and Out Data Flow in Rayven
Here’s how to expand the process based on your point:
After "Define Business Logic and Workflows":
-
➡ Push data out to external systems (APIs, databases, 3rd-party apps).
-
➡ Trigger communications like sending Emails and SMS’s automatically based on logic or events.
Why this is powerful:
-
Two-Way Integration: Rayven not only ingests and processes data but can also push decisions, updates, and notifications externally.
-
Instant Action: Automate alerts, updates, escalations, or business triggers in real-time.
-
True Orchestration: Act as a central brain for your connected operations — input, decision, output — across any ecosystem.
Value to the Business
-
Reduces complexity and cost (no need for multiple systems).
-
Increases user satisfaction with tailored experiences.
-
Accelerates solution building and updating without coding.
-
Ensures governance, security, and data compliance easily.
-
Future-proof: Scale users, data, and interfaces without architecture changes.