
Rayven.io’s grouping and filtering capabilities provide a flexible way to manage and display data across your devices, workflows, and dashboards
Introduction
Rayven.io offers robust data grouping and filtering capabilities, enabling users to customize how data is displayed, managed, and accessed across dashboards, devices, workflows, and user groups. These features provide flexibility in managing permissions, visualizing data, and tailoring the platform to meet the unique needs of each user and organization.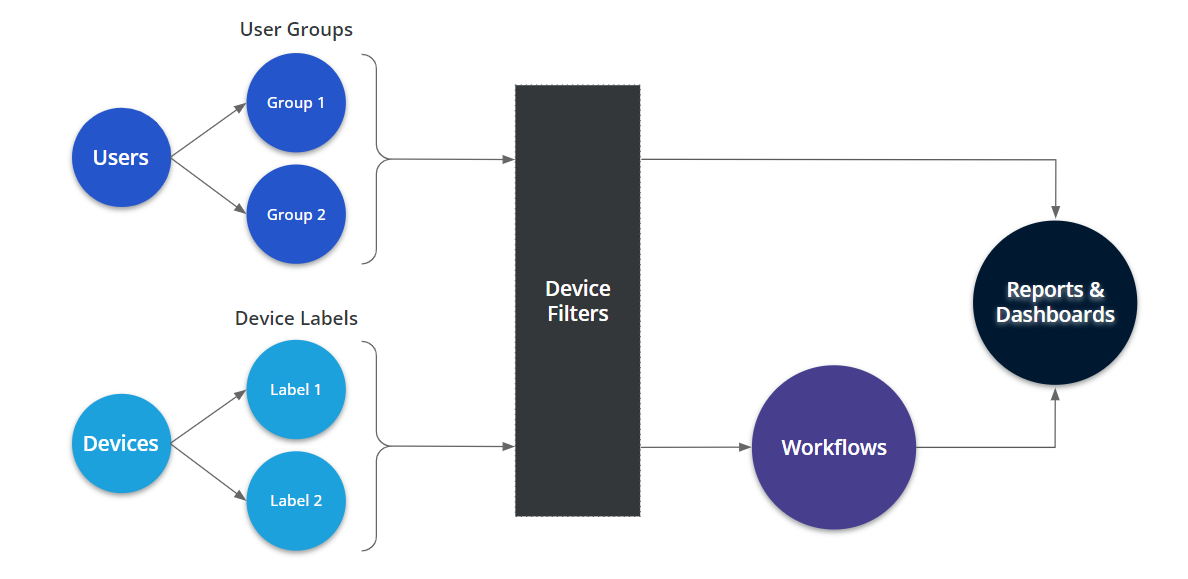
Device Labels
In Rayven.io, all devices can be labeled with various attributes, such as asset type, city name, or location. Device Labels allow you to filter and group devices based on these attributes, giving you the ability to slice and dice your data for customized views.
Example Use Case:
You can use Device Labels to display all devices that share a particular label. For example, if devices are labeled by location, such as "New York," you can quickly display all devices located in New York by selecting the appropriate label.
Benefits of Device Labels:
- Simplifies device management by grouping devices based on key attributes.
- Provides dynamic filtering for dashboards, ensuring that only relevant data is shown.
Device Filters
Device Filters take data grouping a step further by allowing users to combine multiple labels to filter and aggregate data based on more complex criteria. By applying two or more filters, users can narrow down their data to highly specific segments.
Example Use Case:
If you want to filter data for all buses located in New York City, you can create a device filter that combines the Asset Type label set to "Bus" and the Location label set to "New York City." The result is a dashboard displaying data only for New York City buses.
Key Use Cases for Device Filters:
- Data Aggregation: Group and aggregate data based on selected labels to perform targeted calculations or analysis.
- User Permissions: Filter data visibility by device labels to control which users can access specific data based on their role or location.
User Groups
Rayven.io uses User Groups to control what data and dashboards are accessible to individual users. Each user must belong to a user group, and the group’s settings define what data they can view and interact with.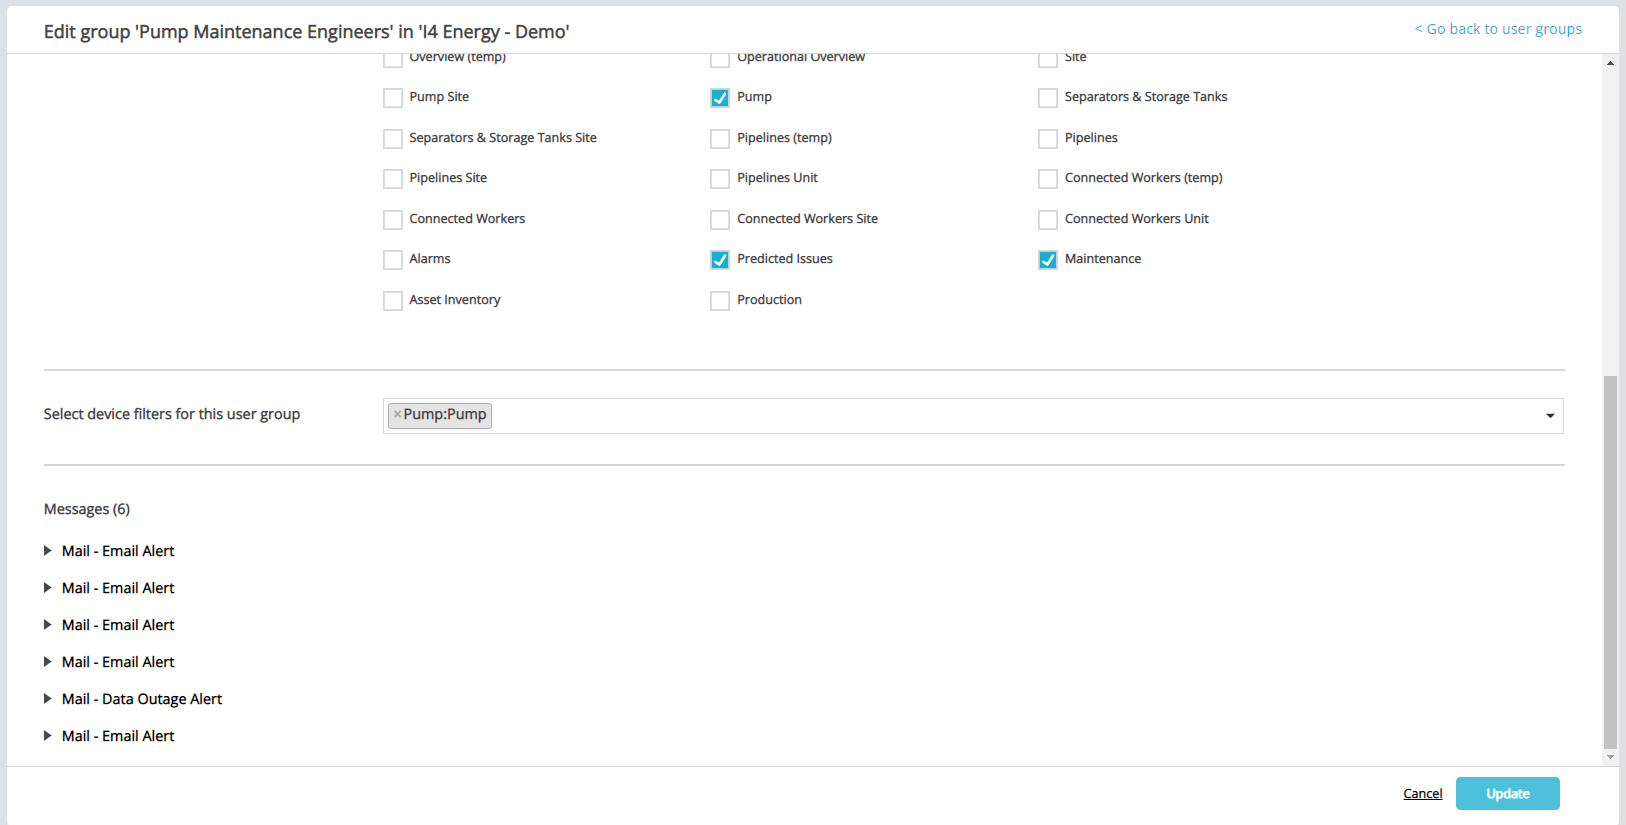
Example Use Case:
To ensure that New York users only access New York-specific data, you can create a New York User Group and apply a device filter for New York-labeled devices. This ensures that only data relevant to their location is available.
Benefits of User Groups:
- Simplifies data access management for large organizations with multiple locations or departments.
- Ensures that users only see data that is relevant to their roles or geographical location.
Grouping Workflow Data
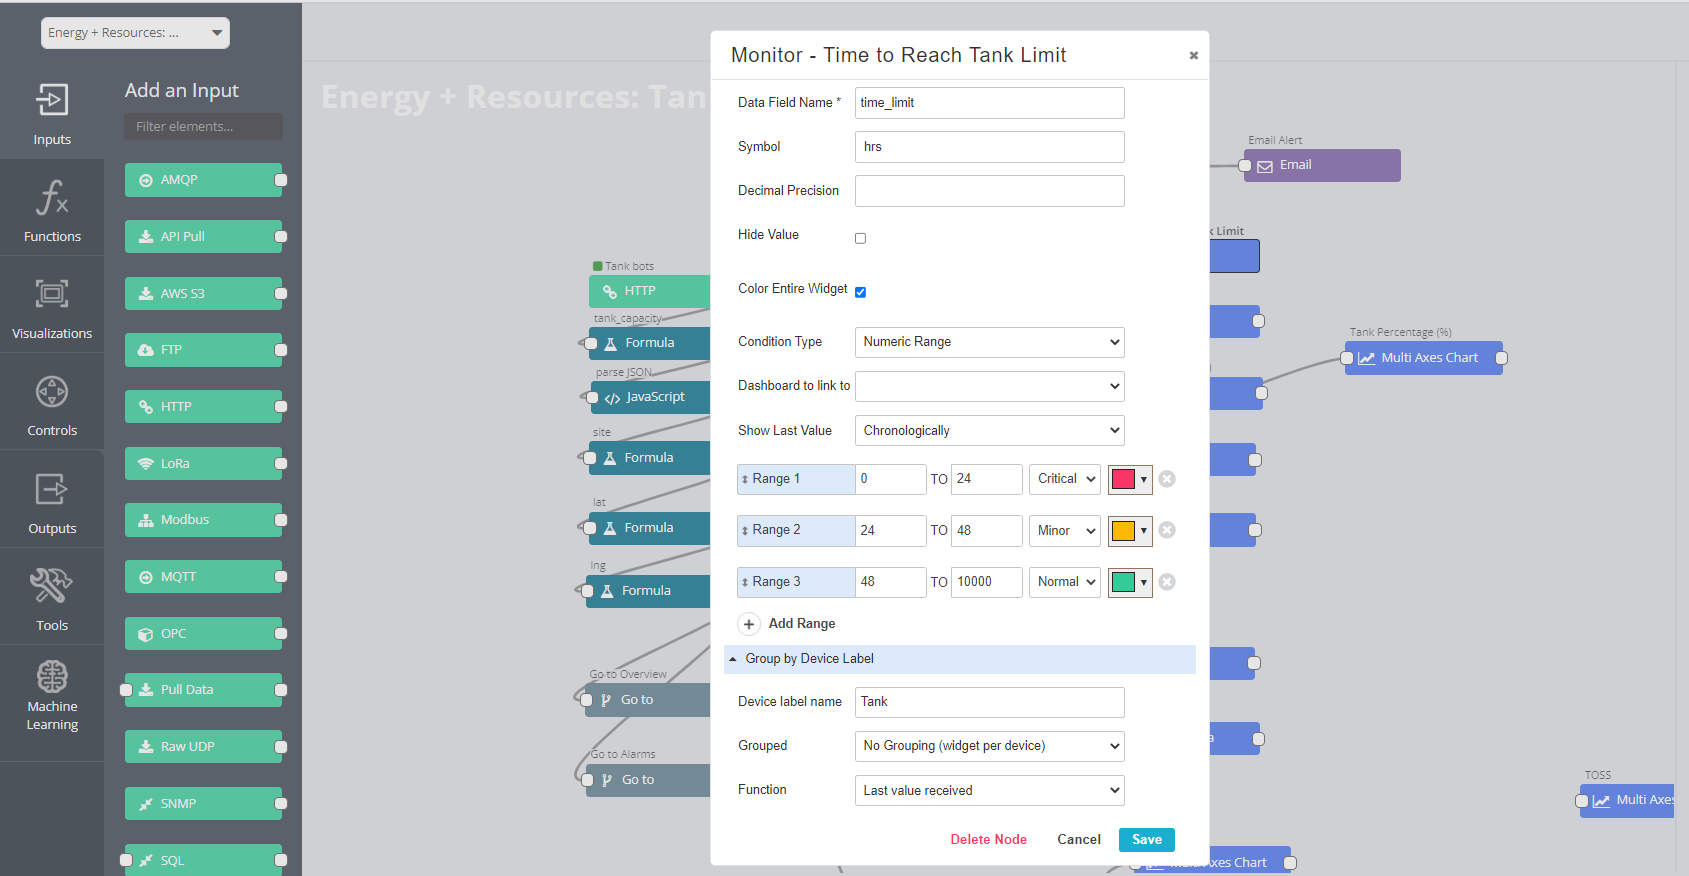
Workflows are the core of data management in Rayven.io, acting as the logical framework for how devices interact with each other and external systems. Throughout your workflows, you may want to group or filter data to trigger specific events, notifications, or actions based on the grouped data.
Workflow Data Filtering:
At various points in your workflow, you can apply filters to group data before it is processed or displayed in a dashboard. You can customize how data is filtered for each widget, ensuring that only the necessary information is processed.
Key Workflow Capabilities:
- Trigger Notifications: Use filtered or grouped data to trigger alerts and notifications.
- Device Commands: Send commands to devices based on grouped data or specific conditions within a workflow.
Filtering Report and Dashboard Data
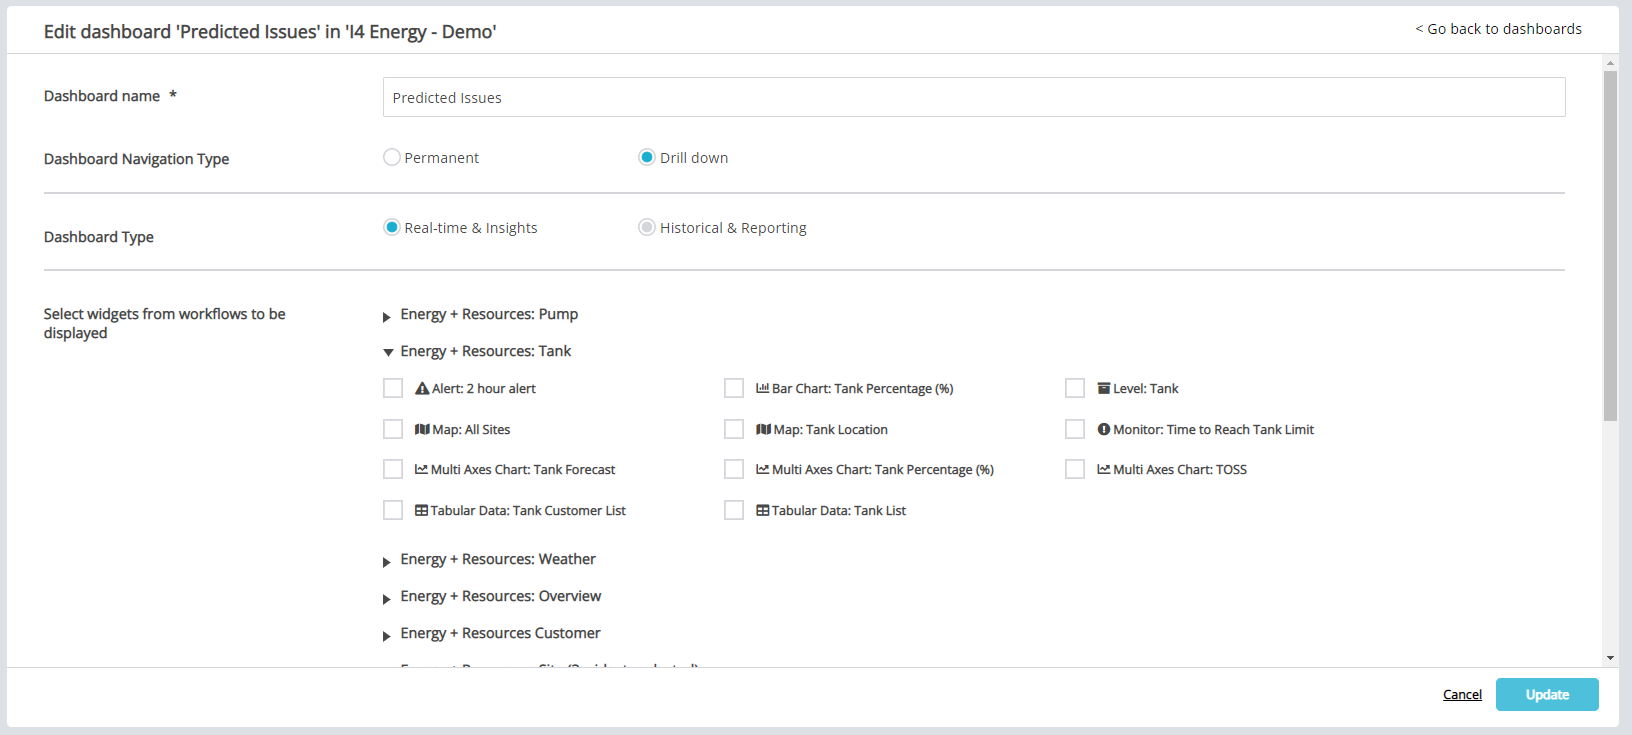
Rayven.io dashboards provide a flexible, powerful way to visualize your data. Using filtered widgets, administrators can control which data is displayed, allowing users to focus on relevant information based on their role or specific needs.
Key Use Cases for Dashboard Filtering:
- Time-Series Analysis: Filter data by specific time frames to analyze patterns and trends.
- Data Anomalies: Highlight unusual data patterns or anomalies by applying targeted filters.
- Customized Views: Configure dashboard nodes with filters to display relevant data sets to different user groups.
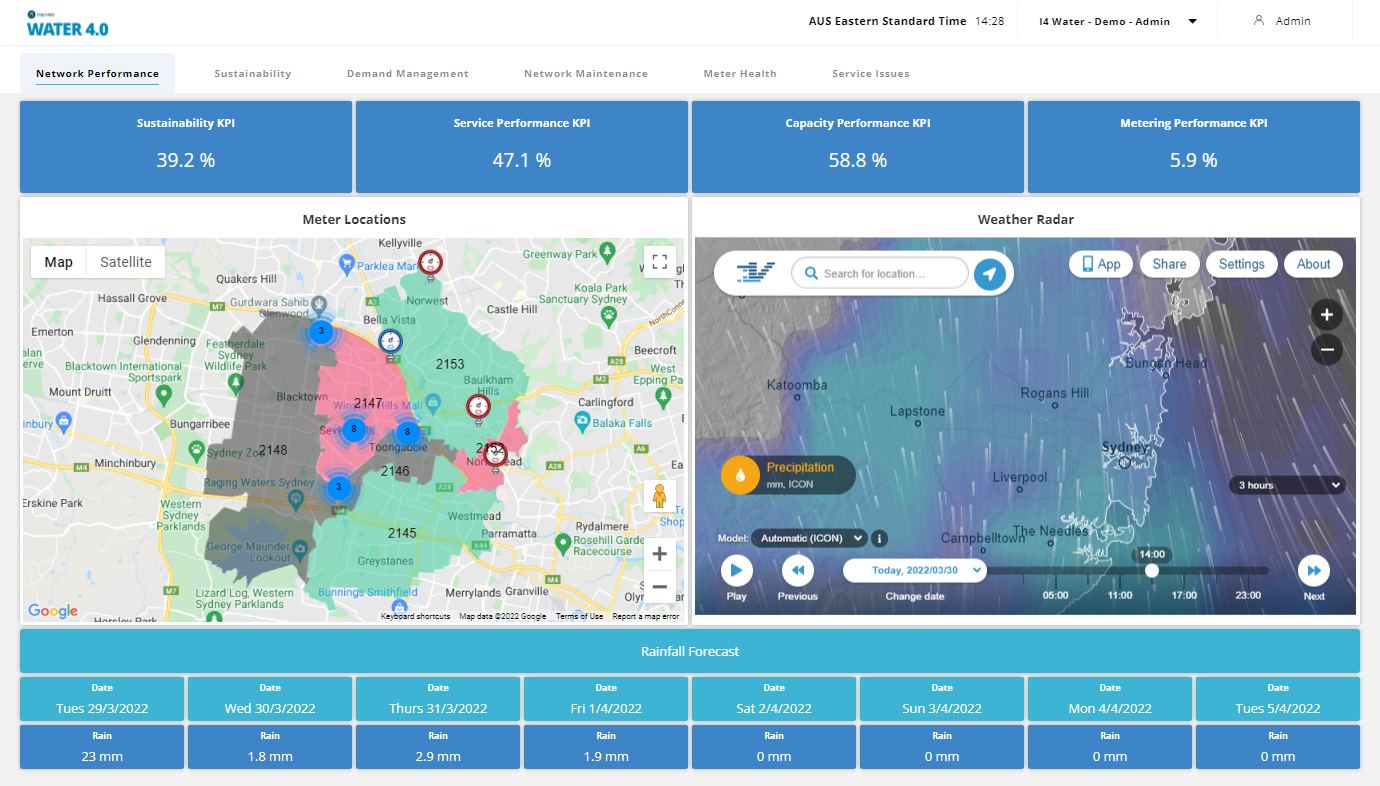
Grouping & Filtering in Action: Example from the Water Industry
To demonstrate how grouping and filtering work in Rayven.io, consider the following example in the water industry:
Scenario:
The solution is designed to display water asset performance metrics for different cities and states, depending on the user group accessing the data.
In the Sydney Maintenance User Group:
- The dashboard is filtered to show only data from assets and devices located in Sydney.
- Data is aggregated and grouped across all Sydney assets to provide a high-level overview.
- Users can drill down into more specific data sets, such as by postcode, house, or individual asset level.
- The Sydney Maintenance User Group has permissions to access specific performance metrics and assess asset health directly from the dashboard.
This example demonstrates how grouping and filtering can streamline data management, ensuring that the right users see the right information in a tailored, efficient way.
Conclusion
Rayven.io’s grouping and filtering capabilities provide a flexible way to manage and display data across your devices, workflows, and dashboards. By leveraging Device Labels, Device Filters, and User Groups, you can ensure that your data is organized and accessible to the appropriate users. Whether you’re managing devices in multiple locations or creating custom dashboards for specific user groups, Rayven.io makes data management seamless and efficient.