
Rayven.io provides a flexible, user-friendly environment to create and customize dashboards tailored to your specific data visualization needs.
Steps to Create a New Dashboard
Follow these steps to create a new dashboard in Rayven.io:
1. Access Rayven Manager
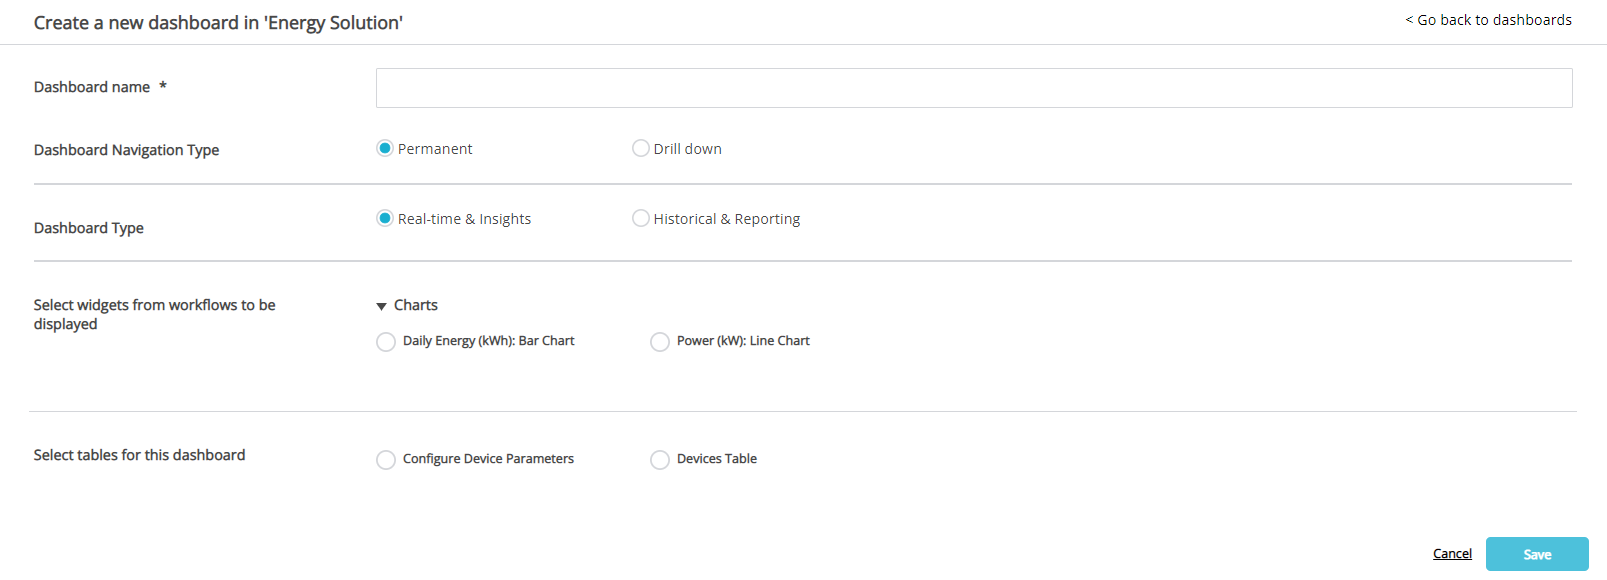
From Rayven Manager, navigate to the Dashboards section and select Create a Dashboard. This will initiate the dashboard creation process.
2. Enter a Dashboard Name
Choose a name that clearly defines the purpose of the dashboard, such as "Sales Performance" or "Equipment Monitoring." The dashboard name can be updated at any time if needed.
3. Select a Dashboard Navigation Type
Rayven.io provides two navigation types to control how the dashboard is accessed within your solution:
- Permanent: The dashboard will be visible and accessible at all times via a row of tabs located at the top of the solution interface. This is useful for dashboards that need to be quickly and regularly accessed.
- Drill-down: The dashboard will only be accessible when clicking on a specific element within another dashboard or data display, such as a value in a table or an icon on a map. This is useful for creating deeper, context-specific dashboards that are accessed based on user interaction.
4. Select a Dashboard Data Type
Choose the data type that best suits the purpose of your dashboard. Rayven.io supports two types of dashboard data:
- Real-time & Insights: Widgets on this dashboard will display the most recent data, while charts will show time-series data up to the present moment. This is ideal for monitoring systems, devices, or business metrics that require up-to-the-minute data.
- Historical & Reporting: For dashboards that require analysis of past data, this option allows users to select a specific historical time period from a drop-down menu. Once a time period is chosen, all widgets will display the relevant data for that period. Note that some widgets, such as maps and monitors, are limited to real-time data only, and cannot be used with a historical data type.
Available time periods for Historical & Reporting dashboards include:
- Last 12 hours
- Last 24 hours
- Last 48 hours
- Last 7 days
- Last 28 days
- Last 90 days
- Custom time period: Define a custom time range that suits your specific reporting requirements.
5. Select Widgets
Widgets are the primary elements used to display your data. You can choose from a variety of widgets that are organized by workflow, ensuring that the data being visualized is relevant to the specific processes you are monitoring or analyzing. Rayven.io offers a wide range of widget types, including charts, tables, maps, and more, to suit your dashboard’s needs.
6. Select Custom Tables
In addition to widgets, you can also add custom tables to your dashboard. Custom tables are useful for displaying detailed information in a structured format, such as lists of data points, recent events, or other tabular data that needs to be easily accessible.
7. Save Your Dashboard
Once all configurations have been set, click Save to finalize the creation of your new dashboard. Your dashboard will now be available based on the navigation type you selected, and data will begin populating the widgets as defined.
Dashboard Types and Use Cases
Example of a Real-Time Dashboard
A real-time dashboard is designed to display the most current data available, making it ideal for operational monitoring, equipment performance tracking, and real-time system alerts. It provides users with immediate insights into ongoing processes and events, ensuring that decision-makers can react swiftly to any changes.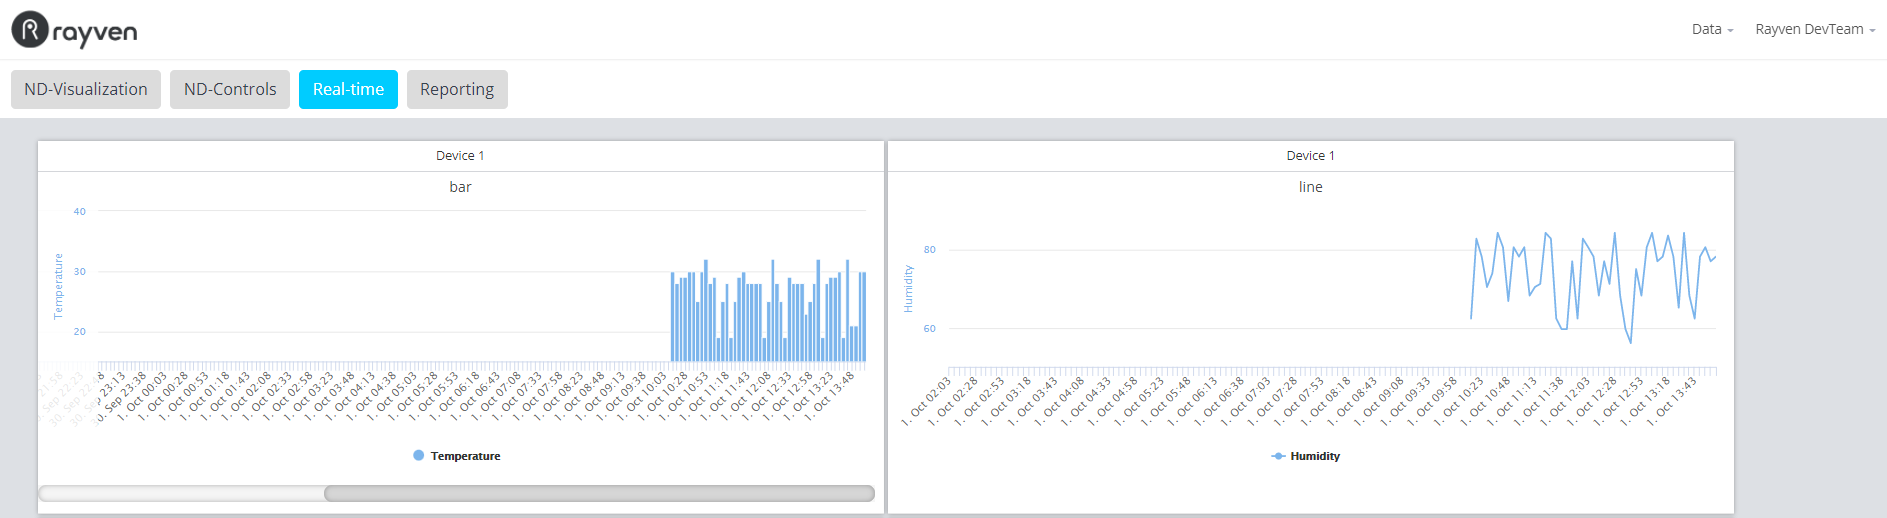
Example of a Historical Dashboard
A historical dashboard is useful for reporting and analysis, where users need to look back at trends and patterns over defined time periods. This type of dashboard is often used in performance reporting, trend analysis, and post-event reviews, where understanding the context of past data is crucial.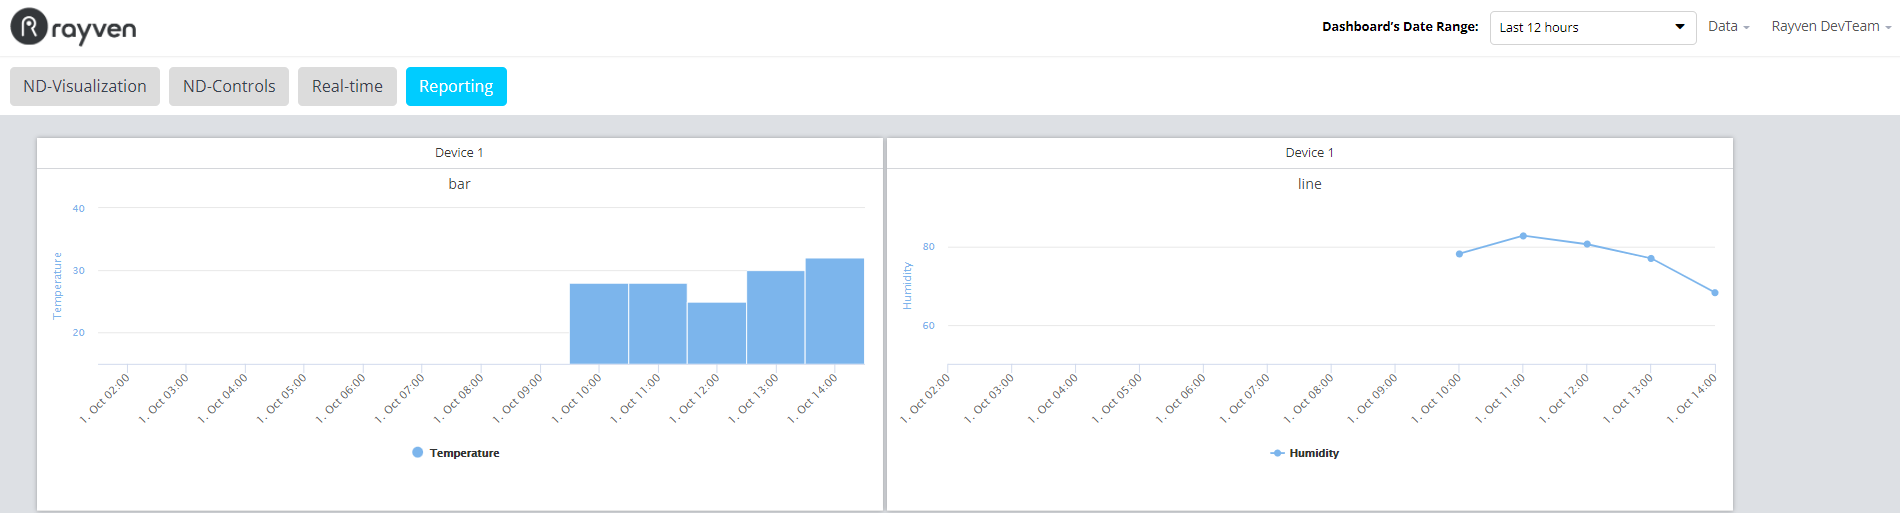
Conclusion
Creating a new dashboard in Rayven.io is a straightforward process that offers powerful customization options. By selecting the right navigation type, data type, widgets, and tables, you can design dashboards that provide meaningful insights into real-time or historical data, enabling more informed business decisions. Whether you're monitoring operations or generating reports, Rayven.io’s dashboard creation tools are flexible enough to meet your needs.