
Interfaces in Rayven.io are customizable pages that allow you to display dashboards, widgets, and visualizations for different use cases — from overviews to drilldowns. This article explains how to add or edit interfaces, configure layout settings, c
Overview
Interfaces in Rayven.io are customizable pages that allow you to display dashboards, widgets, and visualizations for different use cases — from overviews to drilldowns. This article explains how to add or edit interfaces, configure layout settings, choose widgets, and apply design options.
Interfaces are essential for building user-friendly dashboards and tailored UIs for operators, stakeholders, or customers.
Use Cases
-
Create a custom application interface page with HTML.CSS, JS.
-
Build an interactive dashboard with ready to go widgets
-
Add a drilldown page for detailed analysis of a specific asset or event
-
Design branded, data-rich pages for stakeholders or customers
- Add Analytics with our wide range of ready to go widgets
How It Works
Rayven interfaces are created and managed via the Interface Manager. You can:
-
Name the interface and select the flow it belongs to
-
Choose layout type (overview vs. drilldown)
-
Add icons and background styling
-
Select and organize widgets
-
Apply navigation and advanced design settings
Step-by-Step Instructions
Step 1: Access the Interface Editor
-
Go to your project or workspace.
-
Click on the Interface section.
-
Choose Create New Interface or click Edit on an existing one.
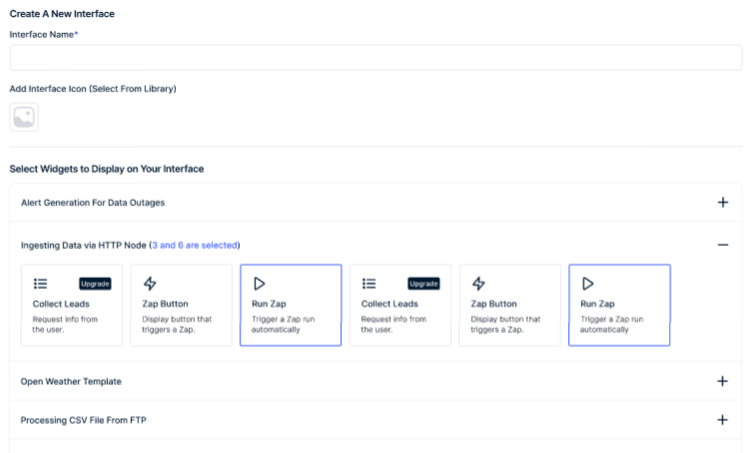
Step 2: Define Basic Settings
| Field | Description |
|---|---|
| Interface Name* | The internal and displayed name for the page |
| Flows | Select the data flow or logic this interface relates to |
| Interface Type | Choose Standard Interface (widget-based page) |
| Interface Icon | Click to select an icon from the Rayven icon library |
| Widgets to Display | Select from available widgets in the system |
🧠 Tip: If this is a drilldown page, name it clearly (e.g., “Device Details” or “Site Overview”).
Step 3: Advanced Settings (Optional)
🔄 Interface Navigation Type
Choose the role this interface plays:
-
Overview Interface: Main summary page with high-level metrics
-
Drilldown Interface: Detailed page for clicking through from widgets
🎨 Interface Background Color
-
Enter a HEX color code (e.g.,
#FFFFFFfor white) -
Use color pickers or brand guidelines
🖼️ Interface Background Image
-
Click Add File to upload an image
-
Recommended:
1920x1080, max size 2MB
-
-
Use for visual branding or context (e.g., site map or layout)
-
Toggle Background Repeat setting:
-
Show Once – Fullscreen image
-
Duplicate – Tiled background
-
Step 4: Save and Preview
-
Click Save Interface.
-
Navigate to the interface to test layout, widget responsiveness, and visual styling.
-
Make updates as needed by returning to the editor.
Best Practices
-
Group related widgets logically (e.g., device metrics, alerts, history)
-
Use overview pages to link to drilldowns via click actions
-
Use a dark background with light-colored widgets for modern visual contrast
-
Keep iconography consistent across interfaces
-
Avoid clutter — limit widgets per page for performance and clarity
Examples
| Use Case | Interface Type | Widgets |
|---|---|---|
| Asset Fleet Overview | Overview | KPI, Chart, Table, Alert List |
| Single Device Details | Drilldown | Line Chart, Logs, Controls |
| Customer Portal Page | Standard | Summary Cards, Image Map, Contact Info |
| Environmental Dashboard | Standard | Map Widget, Air Quality, Weather |
Troubleshooting
-
Widgets not showing?
Check data permissions, visibility settings, or widget configuration. -
Layout looks broken?
Try resizing/reordering widgets and test in full screen. -
Can’t add image?
Ensure file meets size and format limits (JPEG/PNG, under 2MB). -
Colors not applying?
Double-check the HEX code and save before previewing.
Next Steps
👉 How to Add Widgets to an Interface
👉 Creating a Drilldown Dashboard Linked to Devices
👉 How to Use Interface Navigation Rules
👉 How to Control Widget Visibility Based on Role