![Ravyen Transparent 1390x426-1.png]](https://insights.rayven.io/hs-fs/hubfs/000%20-%20Rayven/Rayven%20Brand%20Assets/Rayven%20Logos/Ravyen%20Transparent%201390x426-1.png?height=50&name=Ravyen%20Transparent%201390x426-1.png)
What is an Alert?
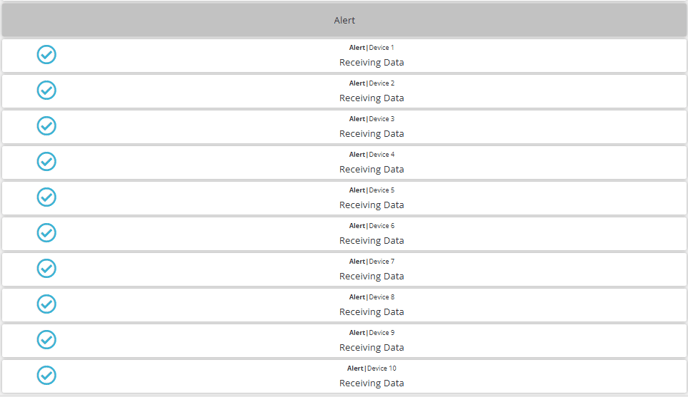
The Alert is to create a widget that offers visual indications when incoming data does not meet specific conditions. This node is highly customizable, allowing users to define logic tailored to their alerting needs. It can be configured to trigger alerts in two main scenarios: first, when data packets are not received within a specified timeframe, providing a notification when expected data fails to arrive. Second, users can set up custom alerts based on defined conditions, such as threshold breaches in specific data fields. This flexibility enables users to monitor data streams effectively, ensuring timely responses to anomalies or deviations from expected behavior. Whether it's detecting data transmission issues or identifying critical thresholds, the Alert node serves as a valuable tool for proactive monitoring and management.
Inputs
The alert node has a mandatory input. The name of the input field in the node depends on the configuration:
|
Input |
Requirement |
Comments |
|
Field Name For Unreceived Output |
Mandatory |
Used when the node alert type is set to ‘Not receiving data’. This is the field that the node will create if no data was received for the configured time period. Users will also be able to configure icons as a visual indicator when the node is used on the dashboard. |
|
Input Data Field |
Mandatory |
Used when the node alert type is set to ‘Custom alert’. This is the field that the node will check and compare against the threshold configured. Users can also configure the icons as visual indication when the node is used on the dashboard. |
Outputs
If alert node is triggered, a JSON packet with the new fields will be sent into the workflow, where users can use it as part of the logic to trigger other parts of the workflow (i.e. SMS or Email Alert).
How to Use
Implementation
In the Rayven Workflow Builder:
- Select Visualizations.
- Drag the Alert node to the canvas.
- Provide an input to the Alert node by connecting it to another node.
- Double click on the Alert node to open the configuration window.
Configuration
|
Section: General |
||
|
This section contains basic configuration elements required for any Alert node implementation |
||
|
Field |
Requirement |
Comments |
|
Widget Name |
Mandatory |
Enter a name for this node. This provides a handle to which you and others can refer, so it should be simple but meaningful and explain the node’s purpose. |
|
Widget Subtitle |
Optional |
Additional text that can be used to explain the data presented by the node. This will appear directly under the Widget Name, in a smaller text size. |
|
Device/Device Label Name |
Optional |
Select this checkbox to display the device or label name on the widget |
|
Background Color |
Optional |
Ability to select desired colors as the alert’s background color. The default color is white. |
|
Alert Type |
Mandatory |
An alert type must be selected from the dropdown menu:
|
|
Section: Not Receiving Data |
||
|
This section contains configuration for the “Not receiving data” option. |
||
|
Field |
Requirement |
Comments |
|
Device hasn’t been sending data for the last: __ minutes |
Mandatory |
Enter an integer to represent the number of minutes related to the rule. For example, entering 10 will result in the node producing an alert if the input data field is not received after 10 minutes. |
|
Output Field Name for Unreceived Output |
Mandatory |
This is the field that the node will create when data is not received for the configured time period. |
|
Icon for receiving data |
Optional |
Select the "CHOOSE ICON" button which will open a library of icons to choose to display on the widget. The widget on the dashboard will display the icon selected if the node receives data within the time period set. |
|
Icon for not receiving data |
Optional |
Select the "CHOOSE ICON" button which will open a library of icons to choose to display on the widget. The widget on the dashboard will display the icon selected if the node did not receive data within the time period set. |
|
Output only the first alert in a sequence |
Optional |
If selected, this will stop alerts from being generated after the first alert occurs. This resets after data is received again. |
|
Send Output when communication restored |
Optional |
If selected, the node will produce an output when data is restored, after it was not received for the time period configured in the node. |
|
Section: Custom Alert |
||
|
This section contains configuration for the “Custom Alerts” option. |
||
|
Field |
Requirement |
Comments |
|
Input Data Field |
Mandatory |
This is the field that the node will check and will provide a visual indication when data breaches a certain threshold. |
|
Operator |
Mandatory |
Select an operator from the dropdown menu:
|
|
Value |
Mandatory |
Enter a numeric value that would check if the input data field is within the range. |
|
Time period condition |
Mandatory |
This allows the node to check the input data field for a certain time period, before producing an alert. |
|
For the last |
Mandatory |
Enter a numeric value which will check if the input data field is within the set condition. |
|
Units |
Mandatory |
Select unit from the dropdown menu:
|
|
Text for Proper State |
Mandatory |
Enter the text that will appear on the widget if the data field did not meet the configured condition. This text will be added to the output JSON if the Field Name for Custom Alert Output is configured. |
|
Icon for proper state |
Optional |
Select the "CHOOSE ICON" button which will open a library of icons to choose to display on the widget. The widget on the dashboard will display the icon selected if the data field did not meet the configured condition. |
|
Text for Improper State |
Mandatory |
Enter the text that will appear on the widget while the data field met the configured condition. This text will be added to the output JSON if the Field Name for Custom Alert Output is configured. |
|
Icon for improper state |
Optional |
Select the "CHOOSE ICON" button which will open a library of icons to choose to display on the widget. The widget on the dashboard will display the icon selected if the data field meets the configured condition. |
|
Field Name for Custom Alert Output |
Optional |
Enter a field name that will be added to the output JSON payload. |
|
Section: Tooltip Info |
||
|
Field |
Requirement |
Comments |
|
Show Tooltip |
Optional |
When checked, it allows users to display their tooltip text on the widget. |
|
Tooltip Text |
Optional |
This section only exists when “Show Tooltip” is checked. Users are able to write any tooltip message they desire which will be displayed on the widget. |
|
Section: Group by Device Label |
||
|
Field |
Requirement |
Comments |
|
Device label name |
Mandatory |
There are no labels available in this box until you have saved at least one in the Device Labels section of the Workspace. Select a Label to use to filter devices. |
|
Grouped |
Mandatory |
Select a method for grouping the widget on the dashboard from the dropdown: No Grouping (widget per device): one widget will appear for each device Group by device label value (Widget per label value): One widget will appear for each value of a label. For example, if the Label is ‘Color’ and there are the values ‘Green’ and ‘Gold’, then two widgets will be displayed, one with devices with Color Label equal to “Green” and one with devices with Color Label equal to “Gold” Group by device label name (One widget): Only one widget will be displayed and this will contain data from all devices. |
Activation
Once the device filters have been selected, click the Activate button and then click Save. The node is ready to receive data into the workflow.
Data Outage Logic

- Set “Not receiving data” under the Alert Type dropdown menu as shown in the image.
- Configure the “Last Seen Type” based on the dropdown menu:
- By receiving time - This is selected by default. It starts the timer based on the timestamp of the last received data packet.
- By timestamp - This would check the timestamp of the data packet.
- Configure the timer by filling in the box with a numeric value in “Device hasn’t been sending data for the last __ minutes”.
- Provide a field name to hold the value generated by the node if the conditions are met.
- If the node is used on the dashboard, users have the option to select an icon for various conditions configured.
- Finally, the alert node can be configured to only send data when the first alert in the sequence is detected and/or when the communication is required.
- Output only the first alert in a sequence - Selecting this, the alert node will send an alert when the first event occurs.
- Send output when communication restores - Selecting this, the alert node will only send an alert when the communication restores.
Custom Logic

- Set “Custom Alerts” under the Alert Type dropdown menu as shown in the image.
- Provide the data field and the condition that the node needs to monitor for.
- Configure the time period condition:
- Minutes - This will send an alert if the condition is met for “x” minutes.
- Times - This will send an alert if the condition is met for “x” times consecutively.
- Next, provide the text to display when the node is in a proper or improper state.
- The node is considered to be in a proper state when the conditions configured within the node are not met.
- The node is considered to be in an improper state when the conditions configured within the node are met.
- Icons can be selected from the library to be associated with the state of the alert node.
- Provide a field name to hold the value generated by the node in either state, which could be used in additional logic implementation downstream.